Using an Online Interactive Textbook for Content Delivery
Introduction
In this document I present some summary findings regarding the use of an online textbook-type resource which was used in a large Mathematics for Economists unit. Enrollment in this unit was 975 students, the vast majority of which Year 1 students with a small proportion of Year 2 students.
The circumstances of the academic year 2020/21 necessitated that all content delivery for this unit had to be moved online. While there are different models possible, the approach taken here was to deliver the material via an online “interactive” textbook. The platform which was used was Mobius by DigitalEd, but note that other platforms like Xerte exist.
While the content was delivered asynchronously, there were twice-weekly Review and Q&A sessions in which students could bring up any questions and problems and in which the lecturer would review some of the key concepts introduced in the online lessons.
In the document below I review what the elements of this resource are. I will also present some student feedback and usage information. The student feedback presented here leads me to conclude that the future of blended learning can look quite different to the past. Having been forced to re-think last year’s delivery has provided me with a significant leap in understanding how content can be delivered asynchronously. As a result I will continue to use asynchronous content delivery even when social distancing restrictions will no longer force our hand. Importantly, and perhaps surprisingly, student feedback seems to support such a conclusion.
The Online Textbook

Figure 1. Tie-in of Mobius Lessons into VLE. (Click for full image)
The online textbook is incorporated into a virtual learning environment (LMS) – here Blackboard. The VLE has weekly sub-pages from which the weekly lessons are linked, as indicated in Figure 1.
In the weekly folders students find links to the respective chapters in the online textbook (the image is merely there to draw some attention to the lessons). A lesson contains the material which would have, traditionally, been covered in a 2 hour lecture.
When clicking on these links students find themselves on a new page which contains the lesson’s (clickable) structure and the content (see Figure 2).
As any standard website (or VLE) the text on these pages can include videos (linked or embedded). An example can be seen in Figure 3.
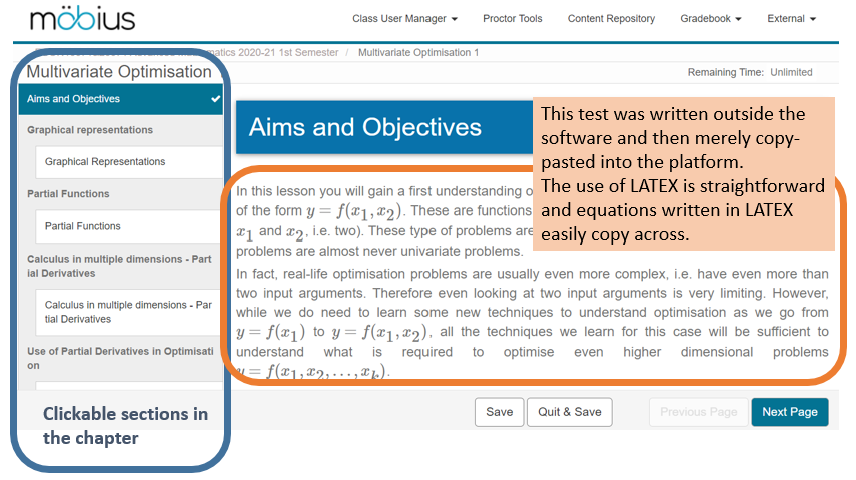
Figure 2. Tie-in of Mobius Lessons into VLE
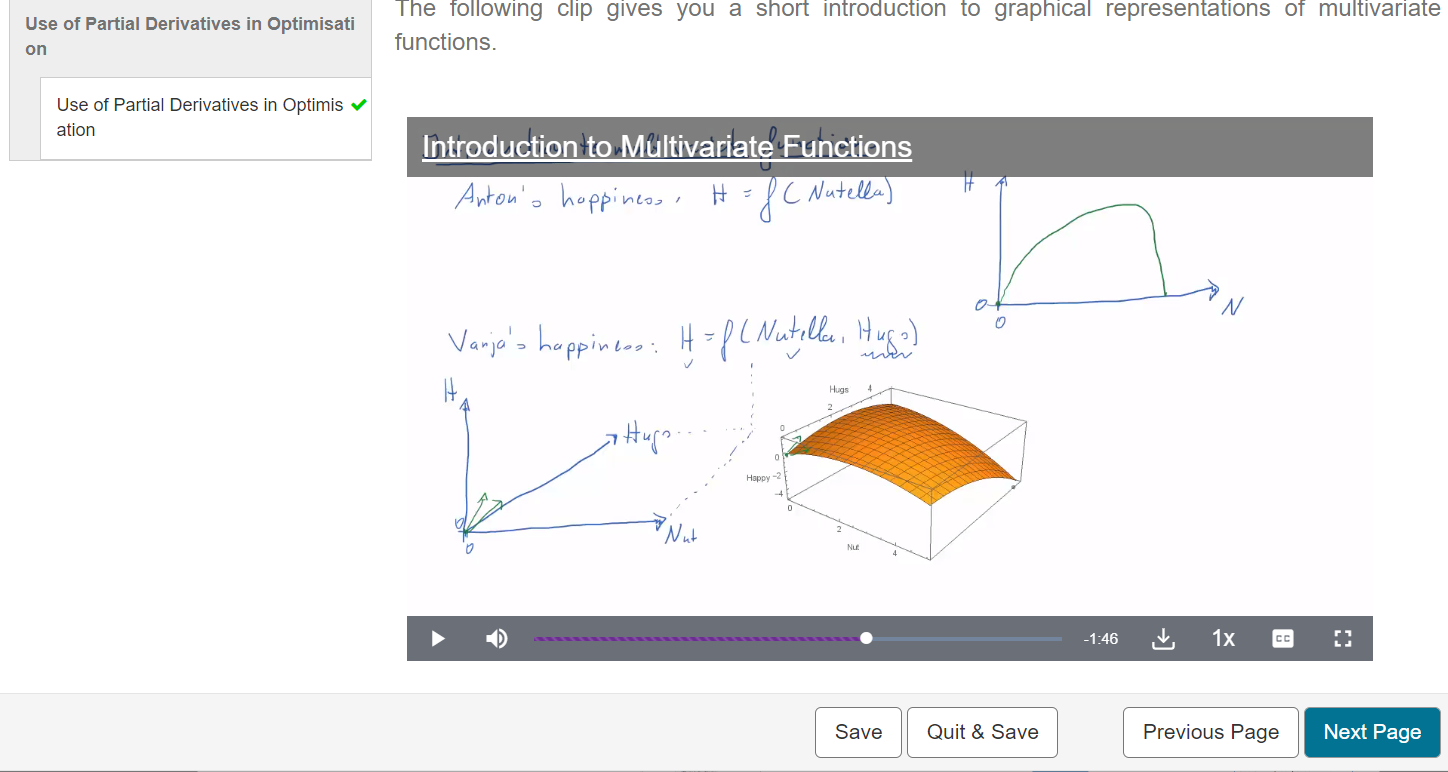
Figure 3. Embedding of online video
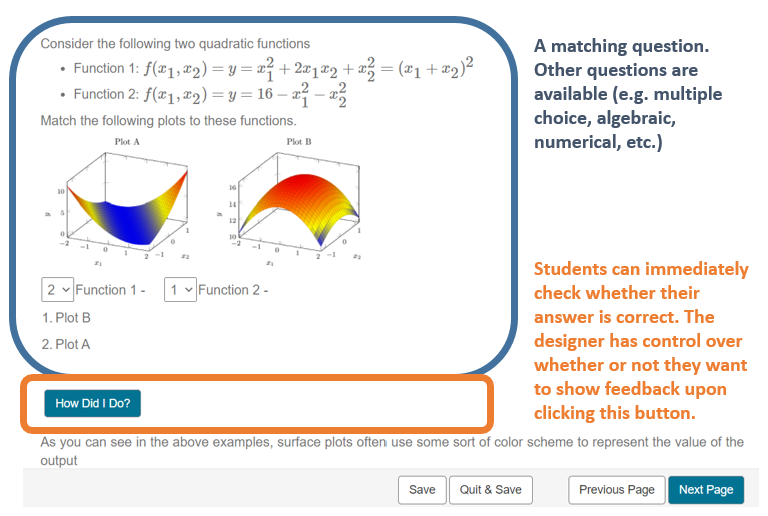
Figure 4. Question embedded in online text
The amount of video content in a lesson is actually quite modest (app. 10 to 25 minutes per lesson).
So far, all could be achieved with standard websites or in fact with some VLEs directly. The element which makes this an interactive textbook are illustrated in Figures 4 and 5.

Figure 5. Question embedded in online text
These questions can be graded and the summary grades across all the questions of a lesson can be copied to the VLE in order to show alongside other assessments (formative or summative).
In the context of this unit these grades are purely used to give formative feedback and students are allowed to answer multiple times.
The reason for including the quizzes into the text is to allow students the opportunity to frequently check their understanding. In principle a question is included after every (testable) bite of information or technique. In addition to these questions students also have weekly quizzes available in which questions test skills and knowledge from across the entire lesson (a week’s material).
A short video with a walk-through a lesson is available from in this YouTube clip (7:43min).
Usage Statistics
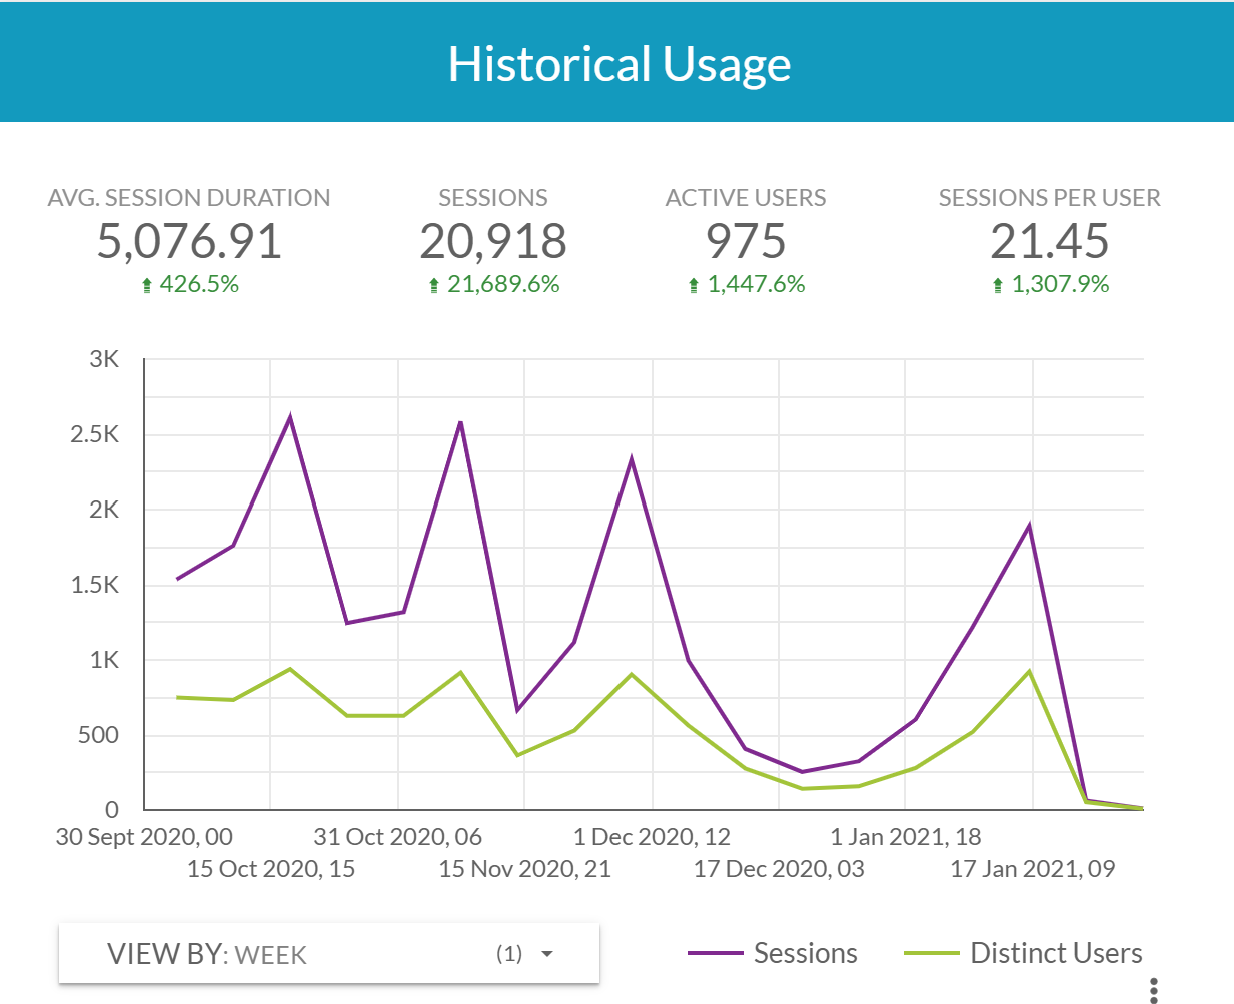
Figure 6. Lesson usage statistics
Let’s look at some usage statistics for these lessons. For the 12 Week Semester there were 9 weeks with new content and hence there were 9 lessons.
From Figure 6 you can see that, on average, students opened a lesson 21 times, so on average every lesson was looked at by a student more than two times. You can see four clear peaks in the usage statistics. These peaks coincide with the three (10% each) assessments during the term and the final exam in January 2021.
Recall that around 975 students were enrolled in the unit. The “Distinct Users” line in the above graph indicates that in assessment weeks everyone engaged with the lessons.
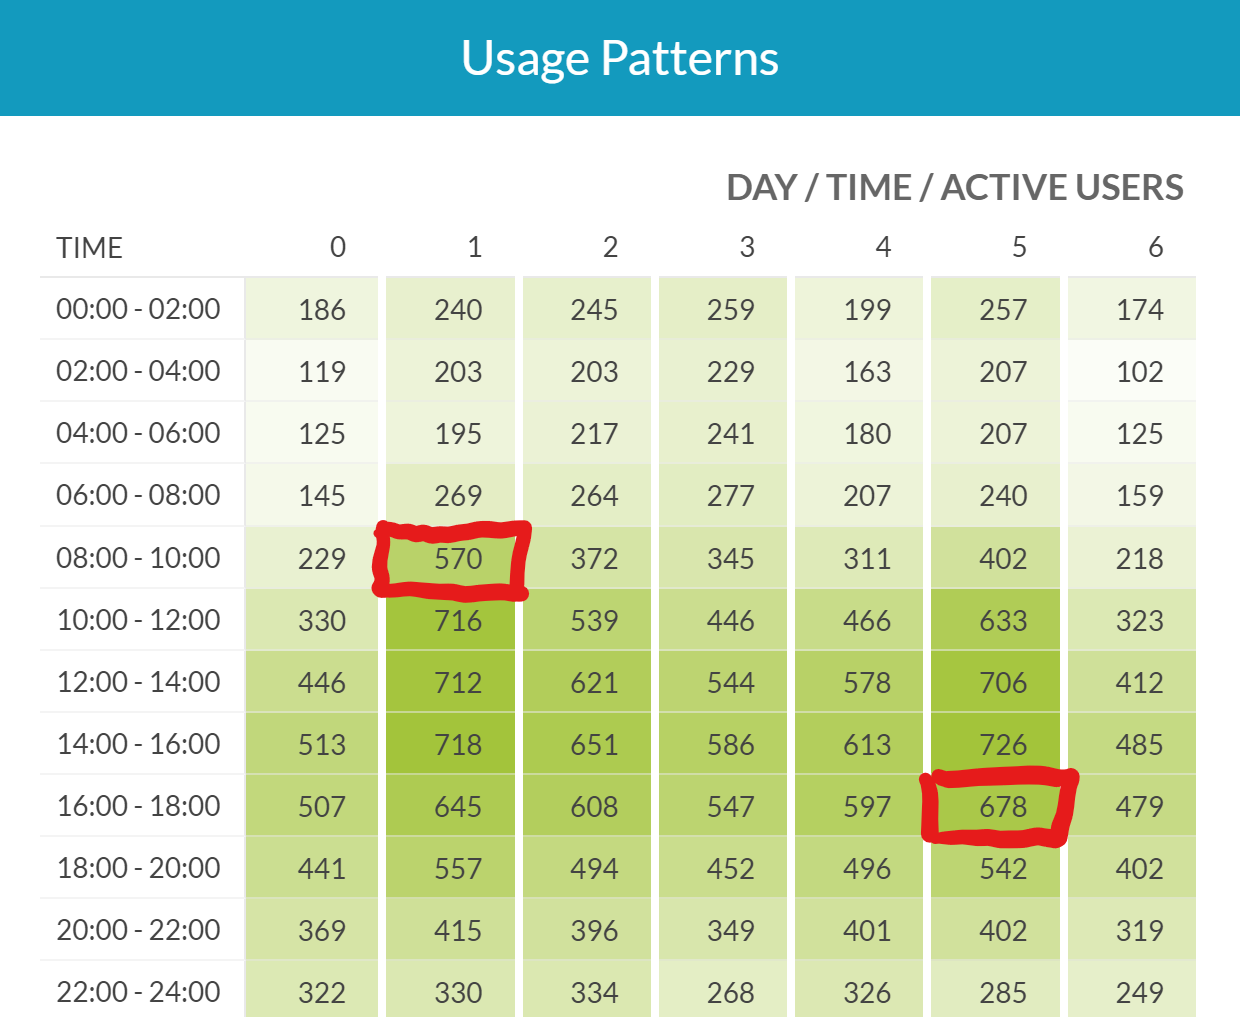
Figure 7. Lesson usage pattern. 0 – Sunday, 1 – Monday, … 6 – Saturday. The timeslots indicated in red contained the weekly Review and Q&A sessions to the entire class.
But even in non-assessment weeks (during term time – weeks beginning 5 Oct to 14 Dec) at least 50% of students do engage with the lessons.
From Figure 7 you can see that the weekly Review and Q&A sessions (time slots highlighted in red), in which the lecturer reviewed some of the important concepts covered in the lessons and responded to student questions (mainly raised through the discussion board but also questions raised live in the session), made students engage with the material most on these days.
You can also see, from the 24h engagement that many students studied abroad.
Student feedback
Two sources of student feedback are summarised here. A survey dedicated to soliciting views on the online textbook was send out to students (May 2021) and their numerical responses are summarised in the next subsection. The open text responses are then analysised, paired up with the open text responses from the standard unit survey (January 2021) and summarised.
Quantitative evaluation
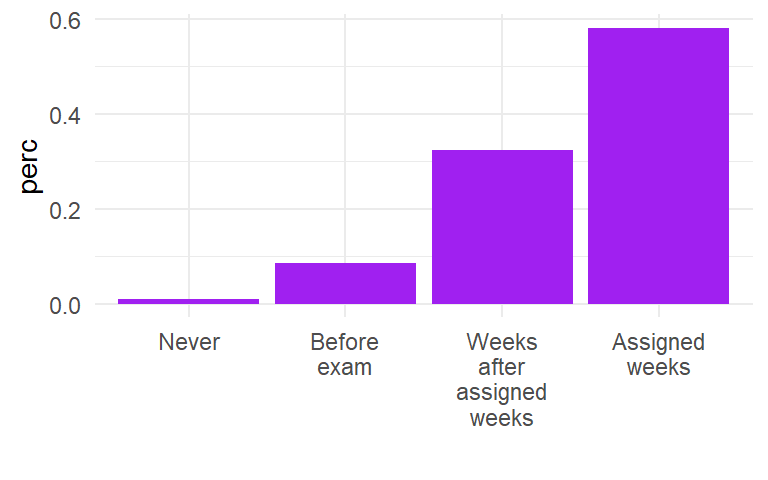
Figure 8. Indication of when students interacted with the material presented in Mobius Lessons.
At the conclusion of the module students were asked to complete a standard unit survey in which many commented on the usefulness of the lessons.
Towards the end of the academic year (in May 2021) and after the same cohort of students studies on the follow-on Advanced Statistics course unit in which the content was mainly delivered through pre-recorded online videos, an additional questionnaire was send out to students which asked specific questions regarding the use of lessons as content delivery vehicles.
Of the 975 students enrolled in the course unit 105 responded (11%). It is impossible to claim that this is a representative sample of the student cohort.
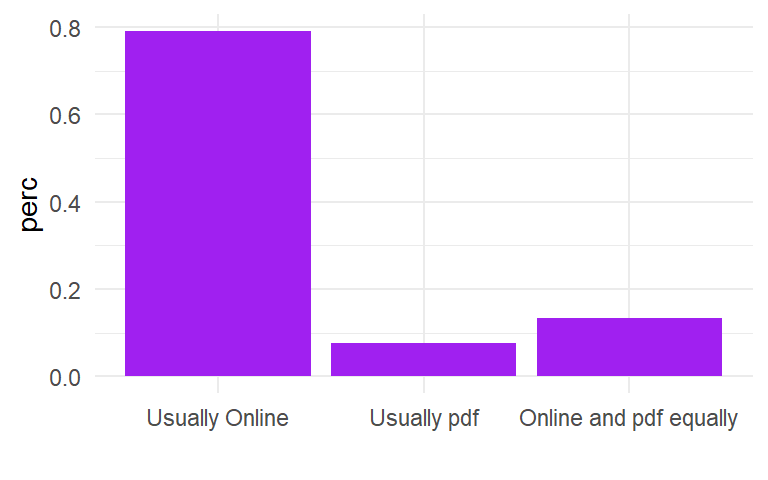
Figure 9. Format choice for Mobius Lessons.
First students were asked if and if so when they used the lessons.
Almost 60% of students indicated that they did use the lesson in the week in which it was presented in the VLE. Less than 10% indicated that they only used the lessons before the exam or not at all. These numbers seem quite consistent with the usage statistics shown in Figure 6. This is important as significant discrepancies between these statistics would indicate that the survey sample is certainly not representative of the student population on this unit. Note that the absence of a discrepancy here does not establish that the sample is representative. With the data available such a judgement is impossible to make.
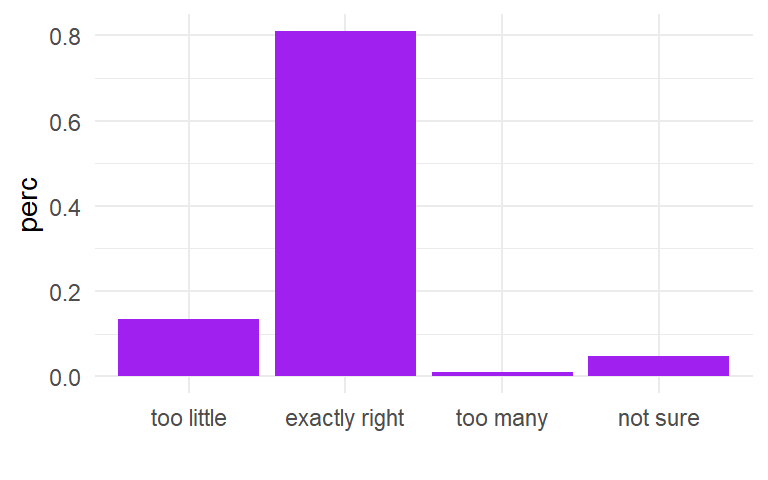
Figure 10. Number of videos in lessons.
As you can see from Figure 1 we also provided a pdf version of the lessons. This would allow students to download the material and access it offline, but does not have any interactive elements. We asked students whether they used the online or pdf versions.
Students were asked about the amount of videos (typically between 10 and 25 minutes per lesson) was appropriate.
It was pleasing to see that students felt that it was appropriate to present the content in predominantly text form, only supplemented by videos.
We also checked whether the amount of questions was appropriate. It is difficult to describe the number of questions. But perhaps it is useful to describe the principle used in the design of these lessons. Questions were included frequently, after small chunks of contents. In principle questions were included after whenever the new content by itself, or in combination with earlier content allowed the formulation of sensible questions.
In order to get a feel whether the content was explained in sufficient detail we asked students about the amount of detail provided in the lessons.
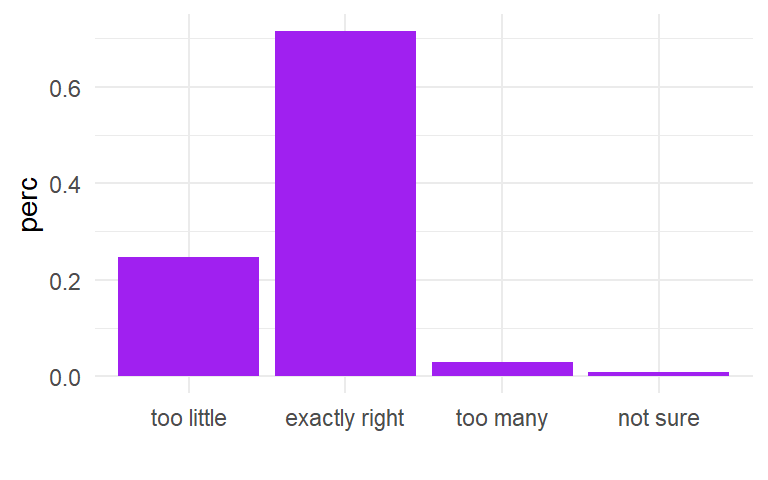
Figure 11. Number of questions build into lessons.
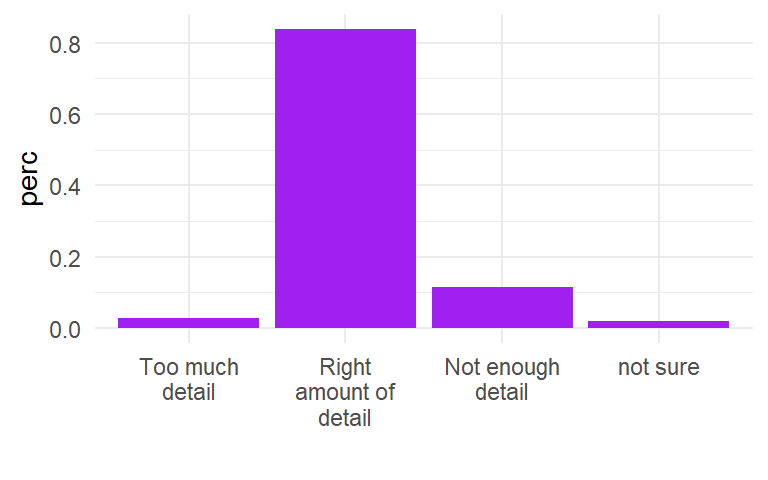
Figure 12. Difficulty of lesson content.
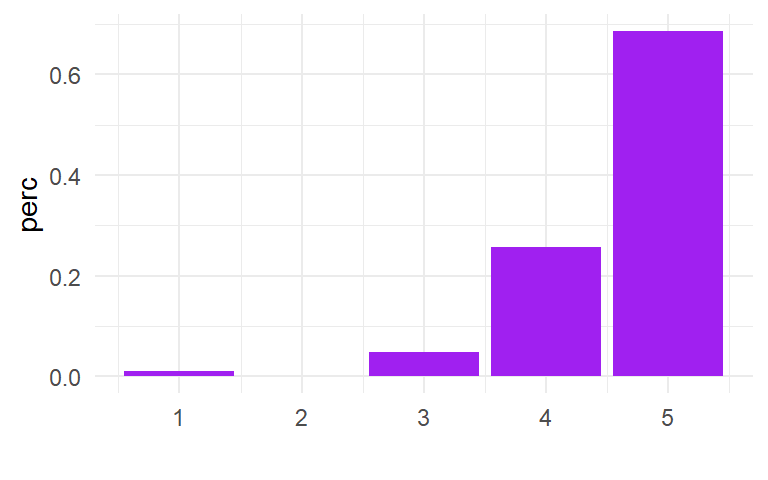
Figure 13. Lesson contribution
Finally we asked students: “Overall I would rate the contribution the lessons made to my learning as follows” where students could provide answers between 1 and 5 (best contribution).
Clearly, the vast majority of students responding to the survey felt that the lessons contributed well to their learning.
Having in mind that in the future content could again be delivered by traditional lectures, we asked students how, in future, they would prefer the content to be delivered. Students were given the following options:
- Content delivered via large group meetings [Lectures]
- Content delivered via online lessons. Large group meetings used for quizzes [Online lessons, Quizzes]
- Content delivered via online lessons. Large group meetings used for review of certain aspects and student queries [Online lessons, Rev Q&A]
- Content delivered via online recordings. Large group meetings used for quizzes [Online videos, Quizzes]
- Content delivered via online recordings. Large group meetings used for review of certain aspects and student queries [Online videos, Rev Q&A]
- not sure
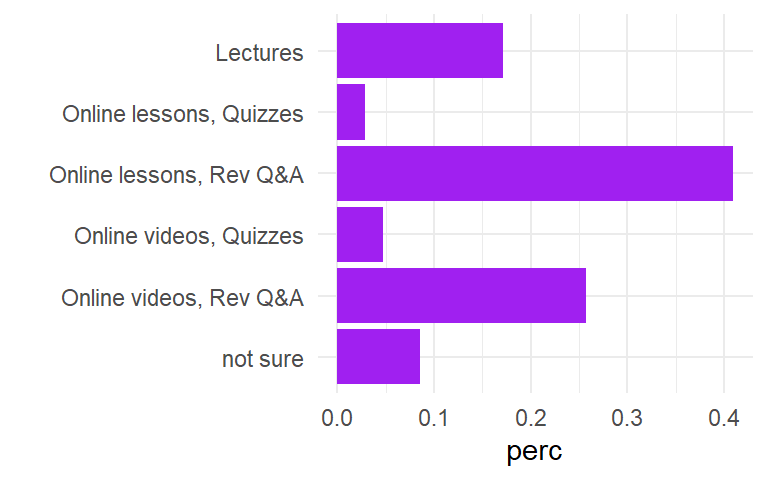
Figure 14. Future delivery
Before looking at the results to this question it is worth making a number of points. Option “Online lessons, Rev Q&A” is the option which students encountered in this academic year. Option “Online videos, Rev Q&A” is the option they would have encountered in a follow-on unit (Advanced Statistics) the students had almost completed by the time the survey was sent out. The “quizzes” option for live meetings was not explained in more detail.
With this information in mind, Figure 14 presents the results.
It is apparent that the vast majority of student prefers the unit’s content to be delivered asynchronously, either via online lessons or via online videos. Less than 20% of the respondents would prefer to return to the “old” model of content delivery via lectures.
Qualitative Evaluation
We start by categorising some responses from the Unit Surveys as that will show what role the online lessons played relative to other important elements in the course unit. This survey is conducted routinely at the end of the unit and has no questions specific to the online lessons. However, students have the opportunity to use free text questions to indicate what elements of the unit they appreciated (“What did you find most helpful?”) and what elements of the unit they think needs improving (“What needs to be improved?”).
The written text comments were categorised into categories which were designed to capture the nature of almost all comments (not included comments which referred directly to the lecturer). A student’s comment could fall into several categories and then it was counted in each of these categories.
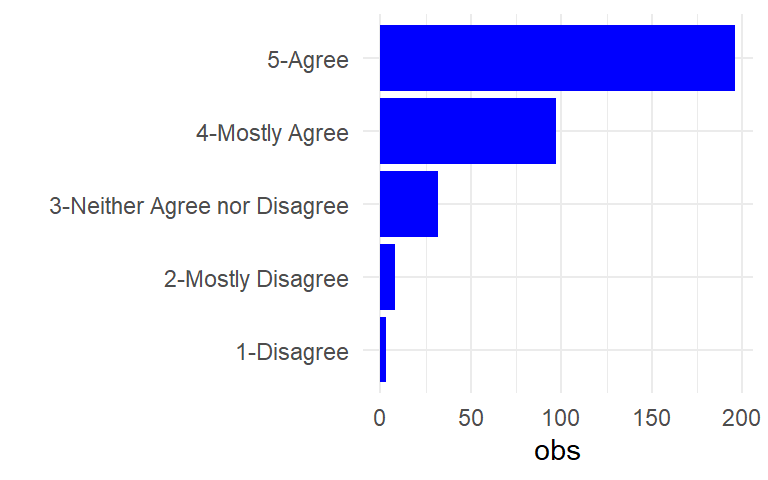
Figure 15. Unit Survey – Responses to – Overall, I would rate this unit as being excellent.
336 out of the 946 students responded to this survey and about 125 left written comments.
The overall judgment on the unit (“Overall, I would rate this unit as being excellent.”) is excellent as shown by the distribution of answers in Figure 14. The overall average (when using the indicated numbers) is 4.41 (out of 5).
On the negative side the Mobius lessons also featured prominently (see Figure 17). Of those who mentioned the Mobius online lessons in their answer to the improvement question only about a third (13 responses) showed fundamental disapproval of the idea of delivering the course content through online lessons, arguing that the material should be delivered live or recorded by the lecturer. The other two thirds mentioned constructive points of improvement (e.g. more videos, more interactive questions or clearer text segments). The 13 students showing fundamental disagreement to the way how the course material is delivered represents just under 10% of the students who gave a written response to either of the open text questions.

Figure 16. Unit Survey – Responses to – What did you find most helpful?
This is interesting as it roughly corresponds to the 17% of students (see Figure 14) who indicated in the online lesson specific survey that they would prefer content to be delivered through traditional lectures. This is an indication that the sample of students which responded to the online lesson specific survey (in May 2021) was quite similar to that which responded to the normal unit survey (in Jan 2021).
Combining the responses of these two questions and seen in the light of the overall excellent feedback to the unit it is apparent that the online lessons not only played a very important part in the learning of the students on this unit, but were also greatly appreciated.
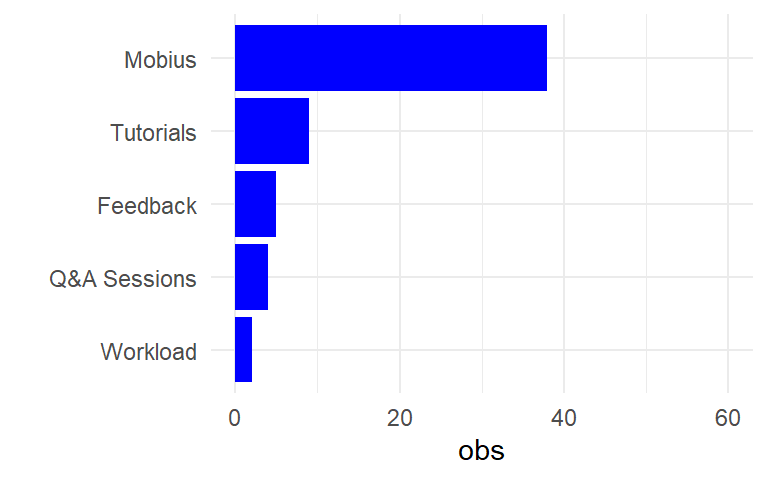
Figure 17. Unit Survey – Responses to – What needs to be improved?
The feedback we receive from the survey designed to obtain feedback specifically on the online lessons provides some further clarification on why students thought that the online lessons contribute to students learning and where they could be improved.
First we categorise the answers to the responses to “What I liked best about the online lessons …”
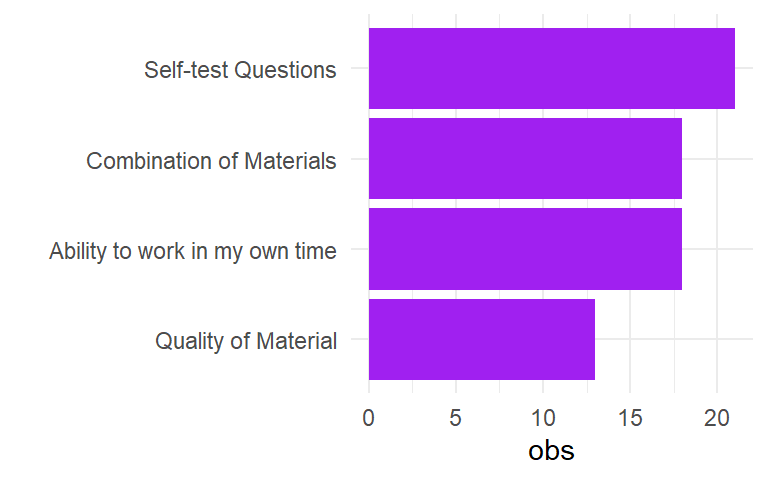
Figure 18. Survey on Online Lessons – Responses to – What I liked best about the online lessons …
The interactivity through the questions which allow students to test their understanding frequently (and hence receive feedback on their understanding) as well as the combination of text and video material inter-woven with worked examples and self-test questions is much appreciated. So is the students’ ability to work on the content in their own time.
When asked how the online lessons could be improved students point to the interactive questions and the videos which they would like to see more of. Equally they point at the possibility of including more worked examples and improving the feedback to the interactive questions.
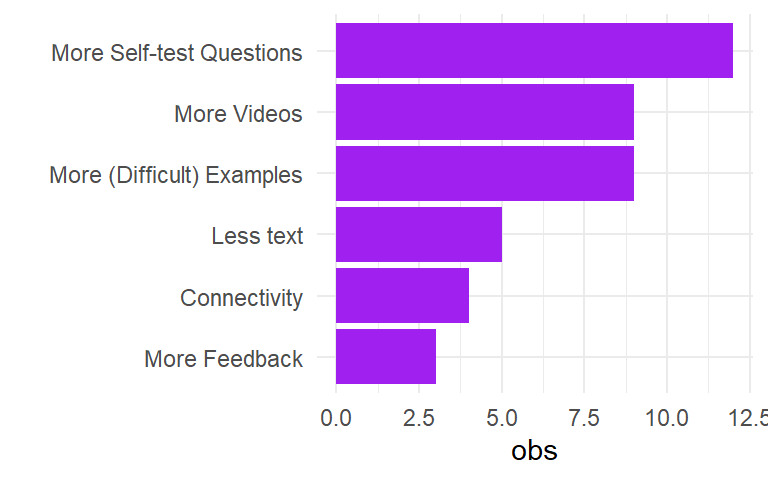
Figure 19. Survey on Online Lessons – Responses to – I think the online lesson could be improved by …
Only a small number of students indicate they encountered issues with the accessibility (Connectivity) of the online lessons. We are not aware of any systematic barriers to access of the lessons by either any operating systems or countries. However, at the beginning of the unit students had to be guided through some minor issues.
Conclusion
In conclusion, the students on ECON10071/ECON20071 Advanced Mathematics provide encouraging feedback for the use of online lessons which mash-up test, videos, worked examples and interactive self-test questions and, in principle, approve of such a content delivery model.
This is both important and encouraging for the future of blended learning as it would, where such a content delivery model is feasible, open up the possibility to totally rethink the content of any live class sessions. Having shown that content can be delivered alternatively, teaching staff can chose to fill live face-to-face sessions with activities which supplement student learning and add to students’ understanding, deepening their learning.
What such activities could be was not the topic of this investigation but the fast growing literature on flipped classrooms can be brought to bear here. On this occasion the live sessions were used to revise some content issues which students signalled difficulties with (or which the experienced lecturer anticipated issues with). This review would normally trigger additional and further questions which were then also addressed in these sessions. A Teaching Assistant who joined during these live session helped tremendously to address and organise issues raised by students during these sessions.
It is my view that, even when we can meet students again in large groups, we should avoid returning to the old model of using lecturers to mainly deliver course content. It is not the comparative advantage of most lecturers and indeed of the live format to do so. Motivating students through real-life applications, deepening students’ understanding through focus on particular difficult aspects of the material and responding to student questions seem activities which are more likely to actively engage students and contribute to their learning.

School: Social Sciences
Discipline: Economics
Academic: Ralf Becker
Course: ECON10071
Cohort Size: 975
Themes: Enhancing learning with technology, online content delivery, Mobius
Visit our Mobius Hub
Ref: 052
Contact Us
+44 (0) 161 306 6000
0 Comments