How to use the Data Tool
The Data Tool consists of three parts:
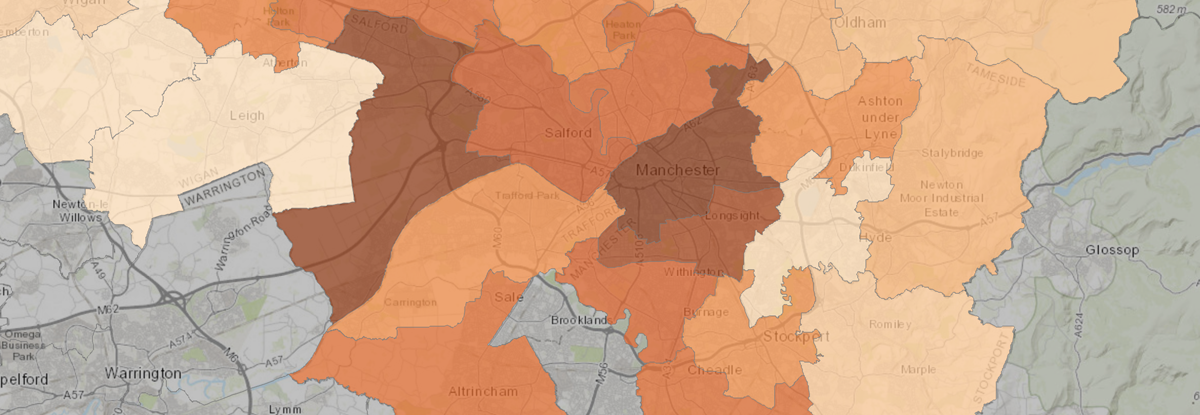
- The Data Mapping Tool offers a map visualisation of selected datasets by language. From the menu select the dataset, the language, and the geographical display mode (ward or parliamentary constituency). The legend will provide a key to the heat map that is generated. Information can be viewed by clicking on individual areas of the map. Data can be downloaded in table format. Data Mapping Tool also contains a Repository of Additional Datasets which cannot be plotted on the map but can be searched by language of interest.
- The section on Profiles of Languages Spoken in Manchester offers background information and selected datasets by language, for a selection of language spoken in the city.
- The section on Areas in Manchester provides information on some of the languages spoken in the city’s individual wards.
Linguasnapp
The interactive map presents images of the city’s linguistic landscapes – public signage in different languages – which have been uploaded using a bespoke smartphone app. The images can be viewed directly along with a street view option and indexing information. The display can be filtered by a series of descriptors, and search results can be downloaded. LinguaSnapp is a crowd sourcing app that is open to public to download and install and to send images to the online database.
Contact Us
+44 (0) 161 275 5999